
From raw data to a clear, useful dashboard
Learn how to frame a question, clean a small dataset and choose charts that explain rather than distract.
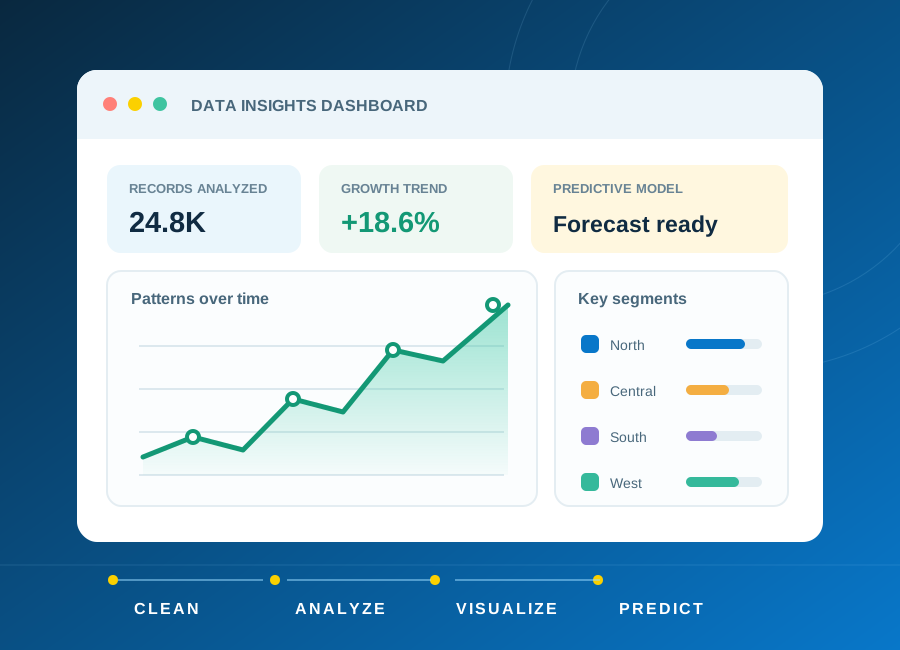
The starting pointA dashboard is useful when someone can explain the decision it supports.
Begin with a question, not a chart
Imagine a fictional training centre wants to understand enquiries by subject and month. Start with a precise question: which subjects receive more enquiries, and how does that change over time? Decide what each row represents before counting anything. One row might be an enquiry, not necessarily a unique learner.
List the fields needed to answer the question. A date, subject and enquiry identifier may be enough. Collecting additional personal details does not automatically improve an analysis and creates responsibilities for privacy and access.
Make the data consistent
Check for missing dates, duplicate identifiers and inconsistent subject names. Treat an empty value differently from zero. Keep a copy of the original file and record each cleaning decision so the process can be repeated or questioned later.
A spreadsheet is a good starting point for inspecting a small table. SQL can help group and filter records, while Python can support repeatable cleaning. The right tool depends on the task; a larger tool does not compensate for unclear definitions.
Choose visualisations with a purpose
Use a bar chart to compare categories and a line chart for a meaningful time sequence. Label units, date ranges and filters. Avoid decorative 3D charts that make values harder to compare. Show the total number of records behind a percentage.
Do not describe a change as a trend based on too little data. Enquiry counts alone cannot prove that a campaign caused an increase or that a course produced an employment outcome. Include the limits of the dataset beside the interpretation.
Explain and validate the result
Check chart totals against the cleaned table. Ask another person to interpret the dashboard without your explanation. If they cannot identify the question, time period or units, revise the design before adding more visuals.
For a portfolio exercise, include the original question, a fictional dataset, a cleaning log, the dashboard and a short limitations note. Predictive modelling is a separate step that requires suitable data, careful evaluation and an understanding of uncertainty.
Try it yourself
- Create 30 fictional enquiries across three months.
- Standardise subject names and document how missing dates are handled.
- Build two charts and write three findings with one limitation.
References and corrections
For additional technical guidance, consult the source documentation:
These independent resources support further learning; they do not endorse ECAREERPLUZ, verify our course delivery or establish certificate recognition. Follow current manufacturer instructions and appropriate supervision for hands-on work.
Publisher: ECAREERPLUZ. Report an error or request clarification. Tool interfaces and requirements can change; confirm current details before acting.